Wednesday, January 7, 2015

SEASONED PRACTICIONER EXPLAINS HOW AN IDEA SYSTEM WORKS

Kerri Kane, Director of Great Ideas @ STCC
Kerri Kane recently joined STCC as Director of Great Ideas, STCC’s idea system.  Formerly Ms. Kane worked at Health New England (HNE), a Massachusetts health insurance company owned by Baystate Health System.  HNE is headquartered in Springfield, Massachusetts and has just over 300 employees.  At HNE Ms. Kane was responsible for leading their idea system called Opportunity for Improvement (OFI).  
Below is an interview with Ms. Kane with questions in bold and her answers that follow:
Q: What similarities and differences do you observe in the idea systems in HNE and STCC?
A: The program structure and functionality is very similar between HNE and STCC because they are both built from the same model developed by Dr. Alan Robinson co-author of Ideas are Free and Idea-Driven Organization. All of the idea boards look very much alike and the meetings are run in a similar fashion. Both idea programs are very focused on ensuring a positive customer experience as well as increasing operational effectiveness.
Rapid changes in the healthcare industry like the Affordable Care Act (ACA) and HNE’s entrance into the Medicare and Medicaid lines of business brought great pressure to adapt.  Often times, the organization grew without adding staff so we had the same number of people trying to accomplish a larger amount of work.  The idea system at HNE gave associates the vehicle to bring forth ideas to increase their own efficiency and drive the changes needed in order to achieve the goals of the organization.
Although the external forces of change may not appear to be as significant in higher education, I would argue that the highly competitive market in which it exists (particularly in Massachusetts) is an even greater source of pressure to change and ‘keep up.’ At STCC, the primary focus of their Great Idea system is the success of the student. STCC realizes that bringing value to the student is one of the keys to long-term success. I believe that is a tremendous differentiator for STCC.
Q: What were some of the initial goals of the idea system at HNE?
A: HNE was very focused on using the OFI system to engage employees through problem identification and solving. The yearly engagement survey has a question ‘My opinion matters at work.’ The OFI program gave everyone a place to voice their opinion, so year after year HNE achieves very high scores in this survey.  Over time HNE began to shift focus from employee engagement to more sophisticated process improvement efforts that focused on transforming company operations, market penetration and healthcare delivery.
Q: What is your impression of the goals of Great Ideas at STCC?
A: My impression is that the college has three main goals: 1) improve services to students and the public; 2) increase employee engagement and team work;  3) make it easier for employees and the institution to embrace change. These goals are tightly linked and aligned with the overall goal  of student success.

Q: Can you talk about how an idea system breaks down barriers between departments in an organization.
Sometimes people don’t understand how their work and/or role fits within the greater workflow (or process). When teams come together to solve an issue, it helps break down the siloed thinking that can happen when you simply ‘do your work.’ Working with a cross-functional team provides a greater understanding of the larger workflow and in turn supplies  better solutions.
Q: What kind of push back did you experience and how was it dealt with?
A: Continuous improvement is not ‘another thing’ to do, but rather the way things should always be done. It is a struggle to build this into the organization and it is important that executive leaders take the lead to gain buy-in from all employees or this can be hard to overcome. However, I believe it has great benefits, long term benefits for any organization that can stay the course.
Q: What helps promote the OFI system?
A: Leadership engagement and ongoing commitment is the number one factor in the system’s success. Without diligent support  and promotion from the leaders within the organization, the system will break down. For some leaders an idea system such as OFI or Great Ideas at STCC is difficult because it requires that they relinquish the problem solving control to the people doing the work.  It can be hard to admit as a leader that you don’t know everything and to trust your front line employees.  This change in behavior requires humbleness and for some a complete change in leadership style.  HNE is now piloting a leadership development program that helps build the skills needed to be successful in ‘coaching to solve.’ Leaders will be trained in small group facilitation, coaching, and learning to develop their own (and their team’s) problem solving capabilities. I am aware that STCC has set up similar training for leaders and team facilitators.

Friday, October 3, 2014

TWO AMERICAS, THE RICH AND EVERYONE ELSE


In a recent article in the NYTimes reported that the fruitsof economic expansion are going to the rich.  In fact, according to an analysis by Pavlina R. Tcherneva an economist at Bard College there has been a disturbing trend since world war 2 that has seen increasing fraction of income growth going to the top 10% and especially to the 1%. 
Professor Tcherneva has been able to show this with two charts, the first showing the portion of increased income during each post-recession recovery that went to the top 10% of richest Americans.


The chart above demonstrates in a simple format the way the economy has been skewed during recoveries toward the more wealthy Americans.  For example, in the recovery of 1949 to 1953, 20 percent went to the top 10% of wage earners.  In the 2001-2007, the share of this upper income decile grew to 89% with only 2% of left for the 90% of Americans.  In the most recent recovery, the upper 10% has grown to 116% which means that the 90% of less wealthy Americans actually saw, during the recovery, their income drop by 16%.

The second chart provides the same information broken down into the top 1% and the remaining 99%.  Not surprisingly, it shows even greater concentration of income going to the top 1%.


All of this demonstrates that while the recovery from the Great Recession of 2008 officially ended in 2009, for the majority of Americans, it continued.  We really do have two Americas, the those at the top and everyone else.


Sunday, August 10, 2014

UNIVERSITY ENDOWMENTS - A CASE OF FINANCIAL TRANSPARENCY


Thomas Piketty in his book "Capitalism in the Twenty-first Century" analyzes data about income and wealth inequality in the US and advanced industrial societies - Canada, Great Britain, Sweden, Germany and France.  For his analysis he breaks the population down in deciles or groups of 10%: the bottom 10%, the next 10% and so on.  His data, while imperfect, show that the top 10% are garnering much more than their share of income. Wealth, according to Piketty, is even more concentrated by the top 10% and even more so by the top 1%.

His figures for the United States show that in 2010 the richest 10% owned the majority of US wealth - 71%.  As one goes up the wealth hierarchy, even much greater concentration is exhibited. According to Piketty in 2010 the top wealthiest 1% of Americans owned an astounding 35% of all US capital assets - equipment, stocks, bonds, treasury bills, factories and buildings, houses, land and the like.

While Piketty and his collaborators have done yeoman work in assembling a database of wealth and income information, there is uncertainty in these figures.  The income figures although not perfect are more reliable because of federal income tax records. Wealth of the rich is more difficult to ascertain because there is no wealth index published and because the rich have found ways - for example, offshore banks - to hide their wealth.  

Nevertheless, there is accurate and complete data for one group of organizations that can be used as a comparison - the endowment of US and Canada higher education institutions both public and private.  This is data is available because all major Canadian and American universities and colleges yearly report their endowments and these figures are published by NACUBO, the National Association of College and University Business Officers.

What these figures show is quite remarkable, mirroring the concentration of wealth that Piketty claims.  NACUBO reports on 828 endowments, but to simplify matters I calculated the concentration of endowment wealth in the top 800 because it easier when looking at groups of 10% and the top 1% to use totals that are divisible by ten and one hundred.  Thus our list starts with Harvard whose 2013 endowment was $32 billion, 334 million and ends with number 800, Mount Ida College with $12.6 million.  

Here are the results: 
The endowment of these top 800 institutions is $438 billion.
The top 10% 80 richest institutions have a total endowment of $320 billion or 70% of the total.
The top 1% consisting of eight universities are in descending order: Harvard, Yale, University of Texas, Stanford, Princeton, M.I.T, Texas A&M System, University of Michigan. The total endowment of these richest eight universities is $139 billion or 30% of the total that is owned by the top 1%.

What this means concretely is that 720 institutions, the bottom 90%, control $138 billion in endowments which happens to be almost exactly equal to the share of the top 1%.  In simple terms the 1% have as much as 90%.  In fact, these figures reproduce quite closely the concentration for wealth for the country as a whole (see paragraph two above).

This is disturbing news if one expects higher education to act as a leveling force in North America.  I will have more to say about that in a subsequent post.


Wednesday, July 16, 2014

STUDENTS OF COLOR: OPENING THE GATES TO MASSACHUSETTS FOUR YEAR PUBLIC UNIVERSITIES

Springfield Technical Community College students outside of DeLiso Hall, an academic classroom building
When we look back on terrible wrongs – slavery, unjust wars, periods of deep and pervasive inequality – we may wonder how individuals tolerated and ignored these realities.  Yet this is, unfortunately, a human tendency that Margaret Heffernan details in her book Willful Blindness: Why we ignore the obvious at our peril.  “We know - intellectually - that confronting an issue is the only way to resolve it. But any resolution will disrupt the status quo. Given the choice between conflict and change on the one hand, and inertia on the other, the ostrich position can seem very attractive.” 

Within public higher education we have a number of issues that have been avoided and ignored yet cry out for discussion and action.  One such is the distribution of individuals of color within public higher education.  Like other states, Massachusetts public higher education continues to be, to a large extent, separate and unequal, with the preponderance of African-American and Latino students – 68% - at the community colleges and the minority - 32% - split between the University of Massachusetts campuses and the nine state universities. 

The good news is that the number of black and Latino students has increased markedly since the fall of 2009 to the fall of 2013, the latest semester for which figures are available.  In fact over these four years within public higher education black student enrollment increased by 19%, Hispanic enrollment by a whopping 46% while white enrollment is down 3%.  These numbers reflect the changing demographics of Massachusetts and the United States as a whole in which the minority population including Asian-Americans is expected to top whites by 2050.

The bad news is that these students of color are flocking into community colleges, not the selective four year publics.  This is significant because a bachelor degree is more and more the best entry to the middle class. The US Census Bureau consistently shows the higher the degree the greater the annual salary, for example in 2009 the average salary for someone with a bachelor degree was $55,700 compared with $42,00o for an associate degree and $33,800 for a high school graduate.

If, as Heffernan states, we are willing to deal with conflict and change, there are number of opportunities to increase black and Hispanic public university enrollment and ultimately bachelor degree attainment:


1) The Commonwealth should increase funding to community colleges to ensure that more students of color complete their associate’s degree and are thus prepared to transfer to universities as juniors.  There is a great disparity between the Commonwealth’s funding of public universities and that of community colleges.  One could argue that community colleges with their open admissions policy require more funding per student rather than less.

2) Public universities should recruit and support with scholarships community college students of color.  Community college graduates come with two important strengths: first they have already completed half of their undergraduate courses and second they have already proved themselves in college.  A robust and dedicated focus on community college transfers will increase university graduates while placing renewed attention to community colleges as a path to the bachelor degree. In general, universities who are seeking to increase enrollment of students of color should go where the students are – at community colleges.

Thursday, April 10, 2014

THE MINIMUM WAGE - IMPLICATIONS FOR COMMUNITY COLLEGE STUDENTS


Add caption

The chart above from the watchdog group MassBudget shows the minimum wage in real terms from 1968 to 2013.  Real terms means what the minimum wage in these various years would buy in today’s dollars.  From the chart it’s easy to see that the 1968 minimum wage in Massachusetts would be worth $10.72 in 2013 when the minimum wage is $8.00.  What this means is that individuals working for minimum wage have gotten a wage cut of $2.72 since 1968; that’s a decrease of 25%.  Or put another way, an individual could work 39 hours in 1968 at minimum wage and make $321.60.  To make the same amount of money at minimum wage in 2014 that person would have to work over 40 hours. 

Since over 80% of our STCC students work, many if not most at minimum wage, the number of hours they must work to support themselves and dependents has correspondingly increased.  This means more time working and less time for their studies.  Is it any wonder so many of our student struggle to complete their associate degree?


Monday, April 7, 2014

GOOD WILL HUNTING'S COMMUNITY COLLEGE PROFESSOR

I was recently attended a meeting of the Massachusetts Board of Higher Education at Worcester State University (WSU), part of the Massachusetts State University system. Barry Maloney the President of WSU spoke first detailing the accomplishments of his University and lauding that fact that “79% of Worcester State faculty are full-time.”  This is an achievement but one that is out of reach of the less well funded Massachusetts community colleges where, according to a study by the Massachusetts Teachers Association (MTA), just 28% of the course sections are taught by full-time faculty.

This made me think of one of the few movies that feature a community college faculty member – Robin Williams playing Dr. Sean Maguire who teaches psychology at Bunker Hill Community College in Boston. 

Maguire challenges and helps the movie’s protagonist, Will Hunting, played by Matt Damon. 

Are there real Sean Maguires teaching at community colleges?  Yes, for I have met many of them - energetic, resourceful and dedicated to helping their students learn and succeed.  But there are not enough of them as evidenced by the statistics above.  Teaching, especially at a community college,  should not be a part-time job.

Tuesday, March 25, 2014

THREE FIFTHS AGAIN

Massachusetts has arrived, somewhat by accident to be sure, at state funding ratios for the three public higher education segments: University of Massachusetts campuses, the nine state universities and the fifteen community colleges.  Not surprisingly funding reflects status; the University of Massachusetts campuses are on top in per student funding, followed by the state universities with the community colleges bringing up the rear.  Interestingly, the ratio of state support per FTE student varies in a simple way.  Community colleges received $3357 roughly three-fifths of that disbursed to the state university undergraduates and they in turn receive $5267, three-fifths of that given to support the University of Massachusetts students that amounts to $8685.

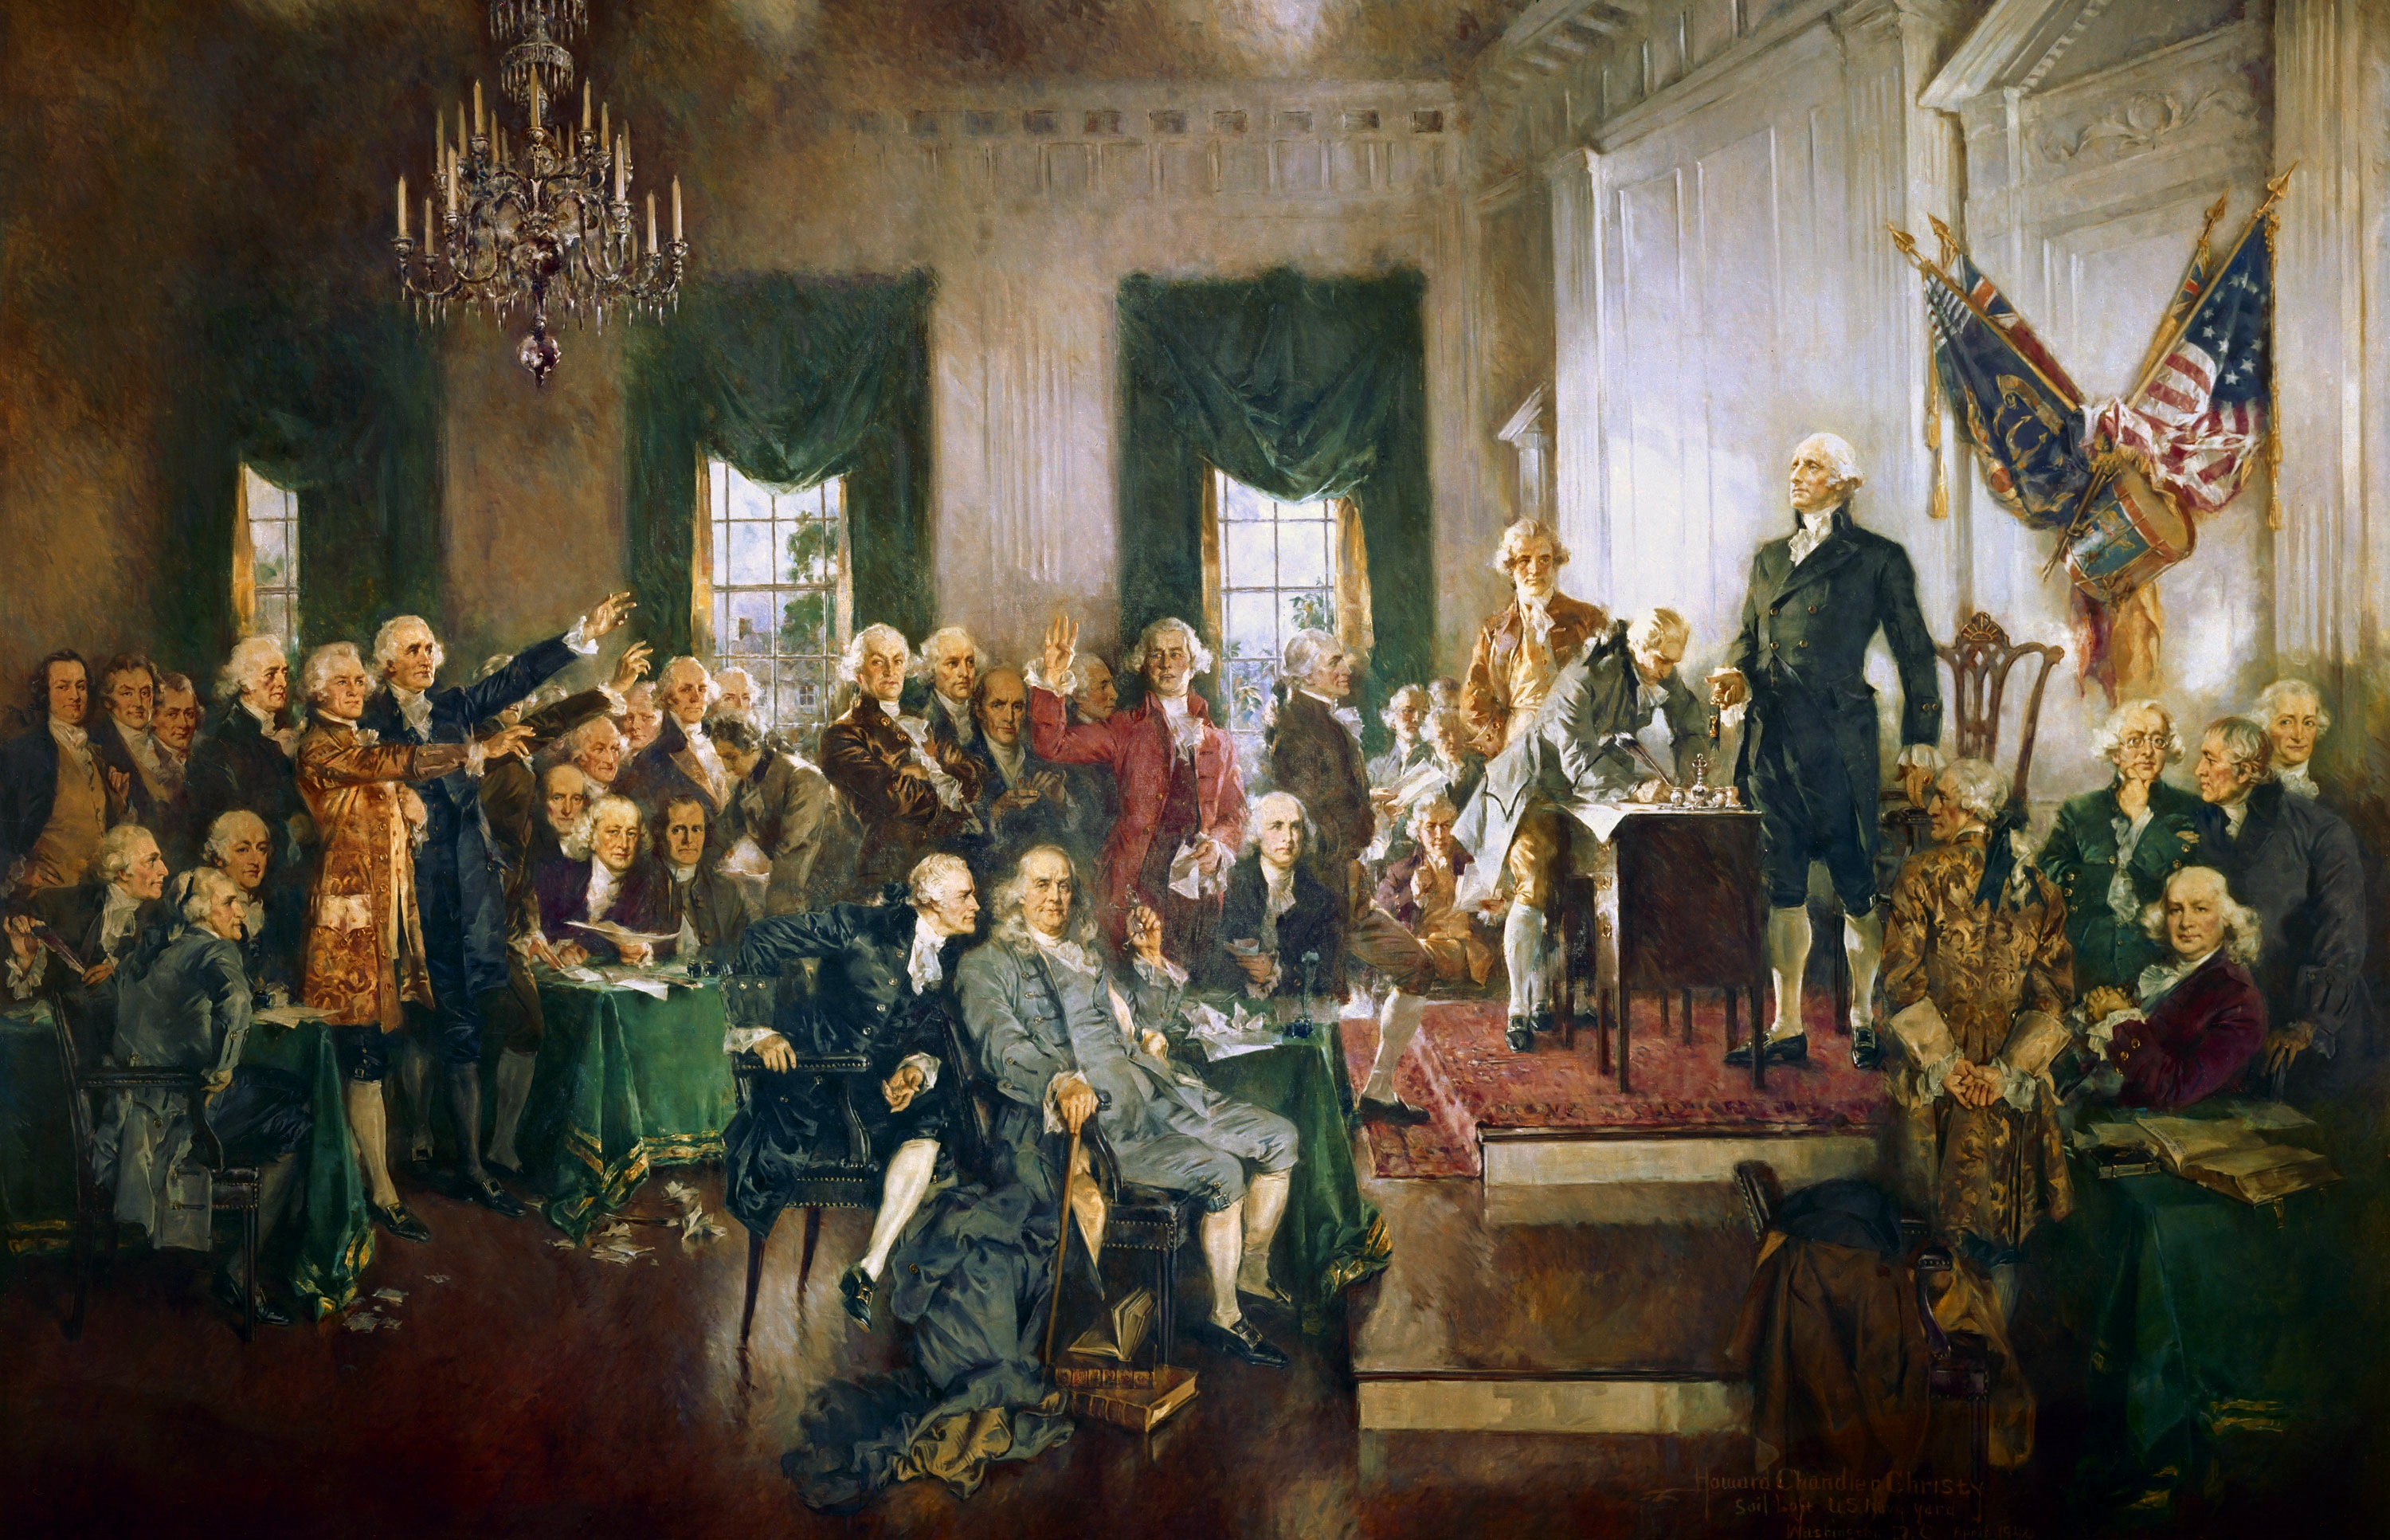
Howard Chandler Christy (1873–1952) Scene from the Constitutional Convention. Source: Wikipedia Commons

That ratio, three-fifths, made me think of a famous three-fifths in American history, the three-fifths compromise during the US Constitutional Convention.  That compromise gave the southern states the right to count slaves as three-fifths of person for the purpose of political apportionment in the US Congress, despite the fact that slaves could not be citizens, could not hold property and could not vote. 


Clearly we have moved a long way in the five generations since the civil war that abolished slavery.  Yet the unequal support of Massachusetts community college students, predominately low to moderate income and many of color, show that we still have a way to go to address old patterns of power and privilege.  Is there a justification for the Commonwealth to give less state support to one group of public higher education students compared with others?  I look forward to that debate.